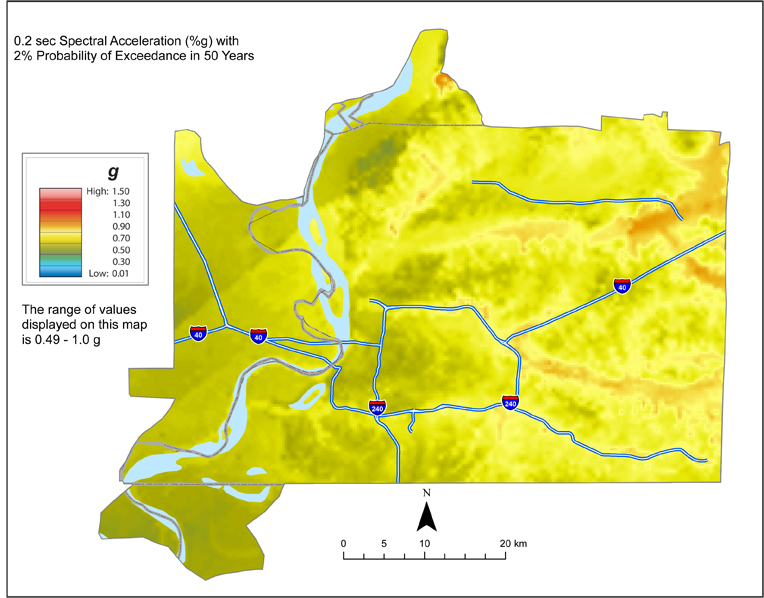
2015 Memphis Urban Hazard Maps
These hazard maps include the effects of local geology in a general sense. Please keep in mind that these maps are not site-specific maps and that they are not building code maps. They are not meant to be used as part of the building code process nor are they meant to substitute for a site-specific study, if needed at a specific location. They are meant to be used as guidance for conducting site-specific studies and to give the user community insight into what might be more realistically expected as to shaking and liquefaction hazard from earthquakes in the central US.
The maps shown here are both probabilistic hazard maps with 2%-in-50yr and 5%-in-50yr probabilities of exceedance and scenario (deterministic) hazard maps for a moment magnitude 7.5 on the southwest arm of the New Madrid seismic zone (repeat of the December 16, 1811 New Madrid earthquake). These hazard maps are technical hazard maps and not simplified hazard maps showing only low, moderate, and severe levels of hazard. Ground motions presented are for peak ground acceleration (PGA), and 0.2 s and 1.0 s spectral acceleration (Sa). Liquefaction hazard maps are also presented for the two probabilistic and the one scenario PGA levels. The liquefaction hazard maps are based on standard penetration test (SPT) based liquefaction probability curves updated for the Memphis and Shelby County area in 2015 as part of the Memphis Area Earthquake Hazards Mapping Project (MAEHMP). The liquefaction hazard maps are for Liquefaction Potential Index (LPI) exceeding 5 (moderate or greater liquefaction hazard) and for LPI exceeding 15 (severe liquefaction hazard). MAEHMP is led by the Center for Earthquake Research and Information (CERI) at the University of Memphis and funded by the U.S. Geological Survey (USGS) via the National Earthquake Hazards Reduction Program (NEHRP).
Simplified shaking and liquefaction maps are not show here. A simplified shaking hazard map for Shelby County would show the entire county subject to severe shaking hazard (PGA exceeding 0.25 g). A simplified liquefaction hazard map would show severe liquefaction hazard in the major river flood plains (Mississippi, Loosahatchie, and Wolf, but not Nonconnah Creek) and low liquefaction hazard elsewhere.
Comments and suggestions are solicited concerning these draft maps from the user community prior to their being finalized and released via CERI and USGS websites. Also solicited are suggestions for other MAEHMP products that could be useful to the user community. Please email your comments and suggestions to Chris Cramer at CERI. Thank you for your input.


